
CSA Scores Explained: How the Seven BASICs Decide Who Gets Audited
· Michael R. Holt
How FMCSA calculates CSA scores: the seven BASICs, severity weights, time weighting, peer grouping and intervention thresholds — plus which scores insurers see that the public cannot.
CSA Scores Explained: How the Seven BASICs Decide Who Gets Audited
Every motor carrier in the United States is being scored continuously, whether or not anyone at the company is watching. The Safety Measurement System takes each roadside inspection, assigns weighted points to every violation, compares the result against similar carriers, and produces a percentile rank in seven categories.
Those percentiles decide who gets a warning letter, whose trucks get pulled over more often, and who receives a compliance review — the on-site audit that produces the safety rating that then governs insurance pricing and shipper access.
Most explanations stop at “there are seven BASICs.” The part that actually matters is the arithmetic underneath, because it determines what you can change and how fast.
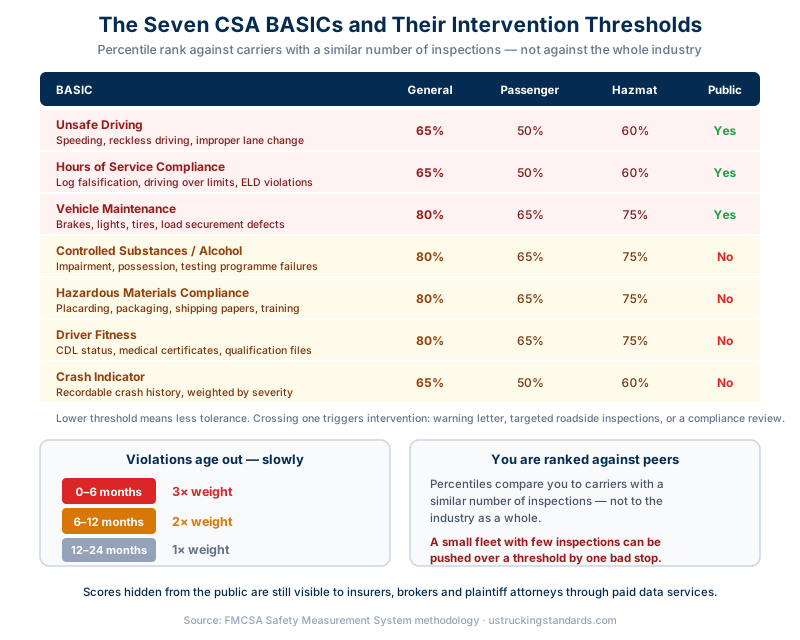
The Seven Categories
Unsafe Driving — speeding, reckless driving, improper lane changes, failure to wear a seatbelt. Driver behaviour observed at roadside.
Hours of Service Compliance — driving beyond limits, false logs, ELD violations, missing supporting documents.
Vehicle Maintenance — brakes, lights, tires, defects, and cargo securement failures. In practice the BASIC that generates the most violations industry-wide, because every inspection examines the vehicle.
Controlled Substances and Alcohol — impairment, possession, and failures in the testing programme.
Hazardous Materials Compliance — placarding, packaging, shipping papers, and training deficiencies. Only applies to carriers that haul placarded loads.
Driver Fitness — CDL validity, medical certificates, and driver qualification file completeness.
Crash Indicator — recordable crash history, weighted by severity and whether a tow or injury was involved.
How a Violation Becomes a Score
This is the mechanism that most carriers never see explained, and understanding it changes what you prioritise.
Each violation carries a severity weight from 1 to 10. A burned-out marker light and a brake out-of-service condition both land in Vehicle Maintenance, but they are not treated alike. An out-of-service violation adds two points on top of the base severity weight. Chasing minor cosmetic defects while brakes go unchecked is a misallocation the scoring system punishes directly.
Violations are then weighted by age. This is the single most useful fact in the system:
| Violation age | Multiplier |
|---|---|
| 0 to 6 months | 3× |
| 6 to 12 months | 2× |
| 12 to 24 months | 1× |
| Over 24 months | Drops out entirely |
A violation from last month hurts three times as much as the same violation from eighteen months ago. Note that this clock governs the score only — the other records a violation lands in run on their own timetables, covered in how long DOT violations stay on your record. Two practical consequences follow. First, a bad quarter damages you quickly and visibly. Second, a clean six months repairs you faster than carriers expect — the heavy weights roll off, and the score falls without you doing anything except not accumulating new violations.
The total is normalised by exposure. Raw points are divided by a measure of how much you operate — inspections, or power units and vehicle miles travelled, depending on the BASIC. Otherwise every large fleet would score worse than every small one simply by being inspected more.
Finally, you are ranked against a peer group. Your percentile is calculated against carriers with a similar number of inspections, not against the industry as a whole. This is the part that catches small fleets off guard: if you have eight inspections on record and two produced violations, your percentile against other carriers with roughly eight inspections can be severe. One bad roadside stop moves a small carrier far more than it moves a large one.
The Thresholds Are Not the Same for Everyone
Crossing an intervention threshold is what triggers FMCSA action. The thresholds vary both by BASIC and by carrier type:
| BASIC | General freight | Passenger | Hazmat |
|---|---|---|---|
| Unsafe Driving | 65% | 50% | 60% |
| HOS Compliance | 65% | 50% | 60% |
| Crash Indicator | 65% | 50% | 60% |
| Vehicle Maintenance | 80% | 65% | 75% |
| Controlled Substances | 80% | 65% | 75% |
| Hazmat Compliance | 80% | 65% | 75% |
| Driver Fitness | 80% | 65% | 75% |
A hazmat carrier is held to a tighter standard than a general freight carrier in every category, and a passenger carrier tighter still. A fleet that adds hazmat authority inherits lower thresholds overnight without any change in its actual driving — the same scores that were comfortable become interventions.
What happens when you cross one escalates in stages: a warning letter first, then your DOT number is flagged for targeted roadside inspections, which generates more inspections, which generates more opportunities for violations. Carriers describe this as a spiral, and it is a fair description — the intervention itself increases your exposure. At the end of the escalation is the on-site compliance review.
What the Public Sees — and What Insurers See
After the FAST Act in 2015, FMCSA removed several BASIC percentiles from public view. Today only three are visible to anyone who looks up your DOT number: Unsafe Driving, HOS Compliance, and Vehicle Maintenance. The other four — Controlled Substances, Hazmat, Driver Fitness, and Crash Indicator — are hidden from the public SMS website.
They are not hidden from the people who matter. The underlying inspection and violation data remains public, and commercial data services reconstruct the full picture and sell it to insurance underwriters, freight brokers running carrier vetting, and plaintiff attorneys preparing litigation. Carriers sometimes assume a hidden BASIC is a private BASIC. It is not — it is merely inconvenient to look up, and the parties with a financial reason to look have already paid for the convenience.
This is why your scores show up in three places at once: in FMCSA’s intervention queue, in your insurance renewal pricing, and in the discovery phase of a lawsuit, where they are offered as evidence that the carrier knew its safety performance was deteriorating. That last use is covered in detail in our breakdown of how a nuclear verdict case gets built.
Challenging a Violation: DataQs
Not every violation on your record is correct. Officers attribute violations to the wrong carrier, cite regulations that do not apply, or record a vehicle that was not yours. The DataQs system is the channel for challenging these.
What succeeds:
- Factual errors — wrong DOT number, wrong driver, wrong vehicle, duplicate entries. Documentation settles these quickly.
- Legally incorrect citations — a violation written under a regulation that does not apply to your operation, backed by the regulatory text.
- Crashes you were not responsible for — FMCSA’s Crash Preventability Determination Program allows certain crash types (being struck in the rear, struck by a wrong-way driver, struck while legally parked, animal strikes) to be reviewed and marked not preventable, which removes them from your Crash Indicator calculation.
What does not succeed: arguing that a violation was technically correct but unfair, or that the officer was overzealous. DataQs reviews accuracy, not reasonableness.
File promptly. The 3× weighting means a successful challenge in month two removes far more score than the same challenge in month twenty, and some reviewing agencies apply time limits.
What Actually Moves Your Scores
Ranked by effect per unit of effort:
- Stop generating new violations. Obvious, but the time weighting makes it the highest-leverage action available. Six clean months with the old violations ageing down produces a larger improvement than any administrative effort.
- Pre-trip inspections that are real. Vehicle Maintenance is where most carriers bleed points, and most of those violations are visible in a yard walkaround — lights, tires, mud flaps, brake adjustment.
- Challenge what is wrong, immediately. DataQs on fresh violations while they still carry 3× weight.
- Watch the Crash Indicator preventability programme. Many carriers never file, and carry preventable-by-someone-else crashes in their score for two years.
- Audit your own DQ files quarterly. Driver Fitness violations are almost entirely paperwork: expired medical certificates, missing annual MVR reviews. They are the easiest category to zero out and they sit in the file waiting to be found. Our DOT compliance checklist covers the full file structure.
The Caveat Worth Stating
CSA has been criticised since its launch, and not only by carriers. The National Academies of Sciences reviewed the methodology and recommended significant changes, particularly around whether percentile ranking against small peer groups produces statistically meaningful comparisons. FMCSA has been developing a revised scoring model in response, and elements of it have been published for comment.
None of that changes what you should do. Whatever replaces the current model will still be built from roadside inspection results, and the carrier with fewer violations will still rank better. The scoring formula is the one thing in this system you cannot control; the inputs are entirely within your reach.
This article explains the SMS methodology in general terms for educational purposes. Thresholds and scoring details are revised periodically — verify current figures against FMCSA’s published SMS methodology before making compliance decisions.